What we learned hunting for bugs in over 1500 codebases with AI
Cantina's AI bug hunter Apex analyzed 1,610 production runs across codebases, discovering predictable sub-linear scaling where doubling compute yields 40% more findings.

What we learned scanning 1500+ codebases with Apex, Cantina’s autonomous bug hunter.
TL;DR:
We measured 1,610 production runs of Apex, Cantina’s AI bug hunter. At a calibrated budget it recovered 100% of the criticals and highs from human audits.
More compute, more findings, and we can show you the curve
When you give Apex more compute, you find more bugs. Across 1,610 production runs on real codebases, the same shape shows up every time, and it’s sub-linear. Doubling your compute adds about 40% more findings, not 100%.
Each dot is one run. Both axes are rescaled so 1× equals a median-budget run, which puts runs on very different codebases on a comparable plot. The dark line is the cohort median; the shaded band is the middle 50% of runs. The dashed line is a fit (findings ∝ compute^0.54). That’s where the “40% per doubling” comes from.
“Validated” means a finding survived Apex’s automated validator stage, same definition used in every chart below.
Validated findings vs. run compute, across the production cohort.
Both axes are relative to the cohort median (1× = a median-budget run). Hover any point for its position on the curve.
A curve through a cloud of dots could just be an average hiding a lot of noise. It isn’t. When we fit the same power law to each run separately (1,033 runs with enough trajectory to fit), the exponent clusters tightly around the cohort value. The system doesn’t scale efficiently on average; it scales the same way almost every run.
Distribution of the per-run scaling exponent βₛ across 1,033 production runs (each fit individually; findings ∝ computeβ). The median is ≈ 0.53, right on the cohort fit, and the mass sits well below the β = 1 line that linear scaling would require. The sub-linear law is a per-run property, not an artifact of averaging.
It goes further than a shared exponent. For the runs that go long enough to bend toward their ceiling, if you rescale each one by its own two fitted constants, the compute it takes to get halfway, and the findings it tops out at, every trajectory falls onto a single master curve. Different codebases, different budgets, one shape.
220 saturating runs, each rescaled by its own fitted half-saturation compute (K) and finding ceiling (Nmax), collapse onto the master curve f′ = t′ / (1 + t′) (black dashed). Faint points are individual run events; the red line is the observed median with its middle-50% band. Bin medians sit within ~10% of the master curve across three orders of magnitude of compute. The scaling behaviour is universal, not codebase-specific.
What this means for buyers
Apex’s return-on-compute is predictable: the same sub-linear law holds run after run, codebase after codebase. Doubling compute adds about 40% to your finding count, not 100%; the next dollar still buys findings, but each one buys fewer than the last. Because the curve is universal, your budget maps to expected coverage in advance. You’re planning against measured behaviour, not a hope.
A ceiling exists, and we can tell when an audit hits it
Some audits saturate: past a point, more compute stops yielding new findings. Among long audits, about one in four (24%) shows a clear ceiling, but the more striking number is the other side: 74% were still scaling at the budget they were given, with only a 2% sliver too ambiguous to call. Most audits, in other words, still had headroom when they stopped.
The bend is visible directly. Each line is one audit, with both axes normalised by that audit’s own totals: every curve runs (0%, 0%) → (100%, 100%), so the only thing that varies is the shape. Saturating audits (red) collect most findings early and flatten; still-scaling audits (blue) track closer to the linear diagonal. We classify the shape with a standard model-selection test (Hill curve vs. power law); the caption gives the exact threshold.
This is the same saturation that produced the master curve in §1. The Hill fit that flags a ceiling here is exactly the fit that hands each run its two constants, half-saturation compute and finding ceiling, and once you rescale by those, these red trajectories are the points that collapse onto the universal curve. Saturation isn’t a separate phenomenon from the scaling law; it is the scaling law, seen at the budgets where it starts to flatten.
Self-normalised cumulative-findings trajectories for representative audits in the cohort. Red = saturating, blue = still-scaling, classified by AIC, a standard penalised goodness-of-fit score, comparing a saturating (Hill) curve against a power law: red is ΔAIC ≤ −4 (saturating fits decisively better); blue is ΔAIC ≥ +4 (power law wins). Thick lines are the per-group median; the dotted diagonal is pure-linear scaling. Because axes are self-normalised, this shows trajectory shape, not finding count. A small codebase that genuinely ran out of bugs and a large one that hit a wall both read as “saturating” here.
The histogram below shows how the cohort splits on this score. The mass sits overwhelmingly to the right (still-scaling, 74%) with a clear-ceiling tail on the left (24%); the indistinguishable middle between −4 and +4 is only 2%, so this is close to a clean two-way split, not a three-way one.
Distribution of the saturation score (ΔAIC) across the cohort. Left of −4: a clear ceiling is visible in the trajectory (24% of long audits). Right of +4: still in the scaling regime (74%). The indistinguishable middle is 2%. These are the proportions the section’s headline figures refer to.
What this means for buyers
Most audits (74%) were still scaling at the budget they were given, meaning more compute would likely have bought more findings. Only about a quarter had clearly saturated, where additional compute is mostly wasted spend. The useful part is that the two cases are distinguishable from the trajectory, and the audit scan acts on it directly: it auto-detects saturation as it runs and stops once it has reached 95% of the estimated finding ceiling. You don’t over-pay on a codebase that has flattened, and you don’t stop short on one that’s still climbing. One honest caveat: a flat trajectory can mean Apex hit a wall or that the codebase genuinely had few bugs left; telling those apart needs the absolute counts, not just the shape.
Severity composition is roughly flat across the audit
If you split each audit’s progress into 10 equal slices and look at what proportion of findings in each slice are critical, high, medium, low, and informational, the bands barely move. Critical hovers around 5–11% per decile, high around 23–35%, medium around 26–34%. No single decile is preferentially loaded with high-severity findings; any slice of an audit is roughly a representative sample of its severity mix.
The one mild trend: high-severity findings are slightly over-represented early (34% in the first decile, 23% in the last) and informational is slightly over-represented late. That’s the only directional shift visible in the data; everything else is decile-to-decile noise.
Cohort-aggregated severity composition by deciles of audit progress (1 = first 10% of the audit’s compute, 10 = last). Each column sums to 100%: it shows what fraction of findings in that decile were each severity. Bands shift by up to 11 percentage points across deciles, with high trending down and informational trending up; the other three are decile-to-decile noise.
What this means for buyers
You can’t game the audit by stopping early. Severity composition is roughly flat across deciles: a half-budget run returns about half the findings of a full-budget run, distributed across severities in nearly the same proportions. There’s a mild drift (high-severity findings concentrate slightly early, informational slightly late) but it’s small relative to the per-severity counts you lose by cutting compute. Critical and medium counts both scale with budget at essentially the same per-decile rate as total findings.
Reproducibility, broken down by severity
If you re-run the same audit on the same codebase, the results will differ, and how much they differ depends on severity and budget. We measured it two ways: a stress test (44 runs on one codebase, deliberately varied across budgets and configurations) that bounds the worst case, and a controlled replicate (3 strictly identical re-runs) that shows what reproducibility looks like once that variation is removed.
The solid lines are the two launch-relevant severity classes, critical and high, across the varied-config family. The y-axis is the coefficient of variation in cumulative synth-valid findings at a given compute level, standard deviation divided by mean. Lower is more reproducible. Both drop roughly an order of magnitude as compute grows, from 200–400% CV at small budgets down into the 30–55% range by mid-budget.
The dotted lines are the controlled version of the same test: 3 strictly identical runs, same codebase, same configuration, no deliberate variation. They sit dramatically lower, and both converge to ~5–6% CV by 0.8× of their budget: critical 5%, high 6%, against ~137% and ~95% for the varied-config family at the same relative budget. Strip out config drift and the hunt is near-deterministic. Hover any point to read its CV.
Coefficient of variation in cumulative findings vs. budget, both rescaled to each set’s own median final budget. Solid = a 44-run varied-config family on a single codebase, the stress test described above (critical red, high orange), counting synth-valid findings, plotted wherever ≥3 runs reached that budget. Dotted (diamond markers) = 3 strictly identical re-runs on a single codebase, counting findings as the run progresses, the controlled replicate. The two sets are different codebases, so this isn’t a perfectly matched A/B, but both normalise to their own median budget, so the shapes compare, and the same-config curves are far tighter at every overlapping budget.
What this means for buyers
Variability shrinks roughly an order of magnitude as compute grows, and a strict same-config re-run is far more reproducible than the varied-config envelope suggests. On 3 identical re-runs, the hunt converged to ~5–6% CV at both critical and high by ~0.8× budget, near-deterministic.
We calibrated the audit scan to match a human audit, on every codebase
§1 showed Apex’s return-on-compute is predictable and universal. That’s the foundation for a product decision: we engineered the audit scan to climb that curve efficiently, then calibrated how much compute it spends so it always reaches the point where it has matched an independent human audit’s critical and high findings, including engagements that cost $500k+ and ran for months. Across the 8 codebases where we have a human audit to check against, it did: every critical, every high.
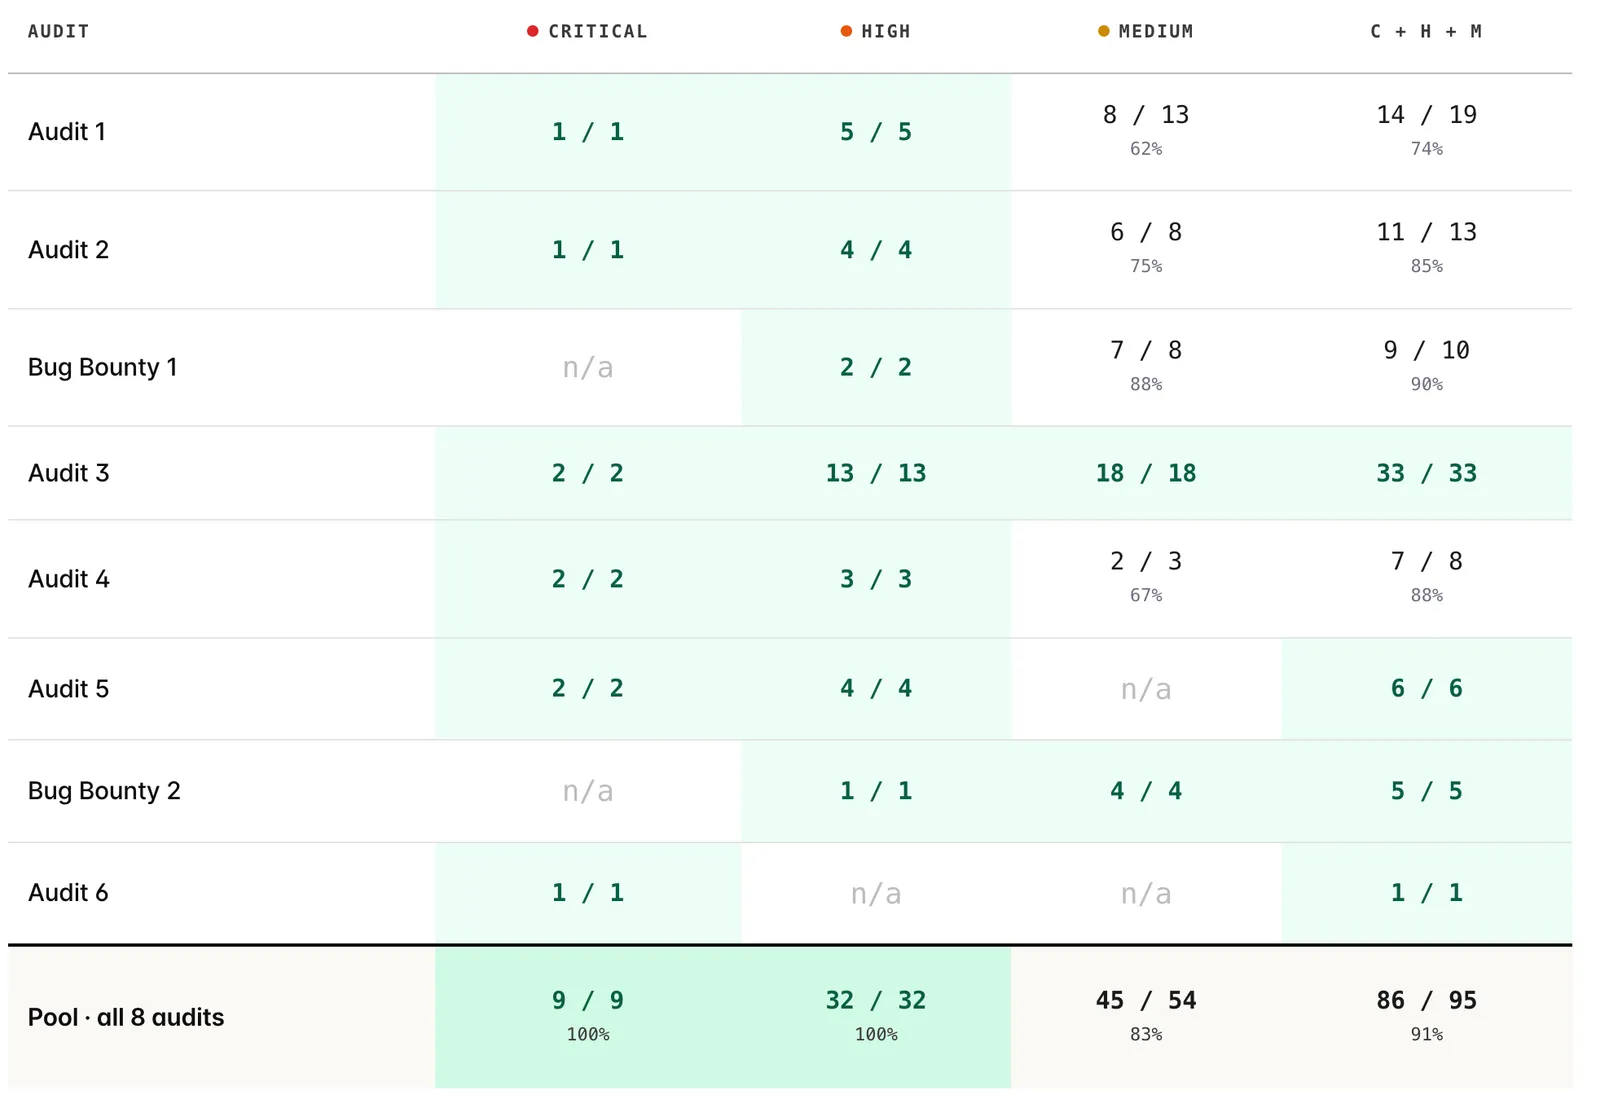
An audit scan is the configuration we run when coverage is the goal: higher per-task budget, deeper exploration, stricter validation. We picked the 8 rows below by availability: every codebase where both an Apex audit scan and an independent human audit exist, with no further filtering. Each cell is bugs Apex recovered / human-confirmed bugs the auditor posted (any non-withdrawn status). Green = 100%; n/a = no human bugs of that severity on that codebase.
Pool stats across 8 audits
Per-audit coverage by severity on the 8 audits where Apex ran an audit scan against an independent human audit on the same codebase. Each cell is bugs Apex recovered / human-confirmed bugs the auditor posted (any non-withdrawn status). Green cells are 100% recovery; n/a means the human audit produced zero bugs of that severity on that codebase, so coverage is undefined. The bottom row is pool coverage: every human-confirmed bug counted once across all 8 audits.
Pool stats across all 8: 9/9 critical, 32/32 high, 45/54 medium (83%), combined 86/95 = 91%. On 5 of the 8 codebases, medium coverage is below 100%; the misses are real and concentrated at that severity.
And this table understates what Apex did. It only credits Apex for matching the human auditor’s findings. It gives no credit for what Apex found beyond them. On multiple of these engagements, the audit scan surfaced critical and high-severity bugs that the original human audit missed entirely, still live in the codebase, which we reported to the teams to fix. The 100% you see here is matched-to-human; the actual finding set was larger.
The calibration mechanism is the saturation stop from §2: the run climbs its own curve and halts once it reaches 95% of its estimated finding ceiling, far enough to clear the human-match point, without burning compute on a codebase that has already flattened. The figures below place each audit on its own scaling curve from §1. For each codebase, the dark bar is the AI compute at which Apex matched 100% of the human-confirmed crit + high set; the light grey bar is where the run actually stopped (its 95%-ceiling point). The amber marker is where that codebase’s actual human-audit budget would land on the same axis, if it were spent on AI compute at our blended provider rate. Everything is rescaled by the cohort-median run compute (1× = a median production run).
Per-audit AI compute (relative to cohort-median run compute, log scale). Dark bar: cumulative compute at which Apex matched 100% of the human-confirmed crit + high set. Light bar: where the run actually stopped. Amber diamond: the AI-compute-equivalent of this codebase’s actual human-audit cost, at a blended provider rate. Dotted line: a median-budget run in the production cohort (1×).
Per-audit AI compute (relative to cohort-median run compute, log scale). Dark bar: cumulative compute at which Apex matched 100% of the human-confirmed crit + high set. Light bar: where the run actually stopped. Amber diamond: the AI-compute-equivalent of this codebase’s actual human-audit cost, at a blended provider rate. Dotted line: median run in the production cohort (1×). On every audit, the amber line sits one to several orders of magnitude to the right of the compute Apex needed to match the human’s crit + high set.

Per-audit cumulative findings vs. AI compute, rescaled by the cohort-median run compute (log–log). Red dashed line: the AI compute at which 100% of the human-confirmed crit + high set has been recovered. Solid amber line: this codebase’s specific human-audit cost expressed as equivalent AI compute. Dotted line: median run in the production cohort (1×).
What this means for buyers
The audit scan is calibrated to reach a human-audit’s critical + high findings, and on every codebase here it did, at a fraction of the compute that the human-audit budget would buy. Because the scaling curve from §1 is universal, that calibration travels: the same compute target lands at the match point codebase after codebase, not just on average. Two honest qualifiers: “match” is measured against the human’s confirmed set (and as noted above, Apex frequently found more, including live crit/high the humans missed); and this is measured on 8 codebases with human ground truth, a strong, consistent signal rather than a population guarantee.
Run an audit scan on your code
Point Apex at your repository and get critical and high coverage fast. Buying for a portfolio or running a firm? Talk to us about bundle pricing.